

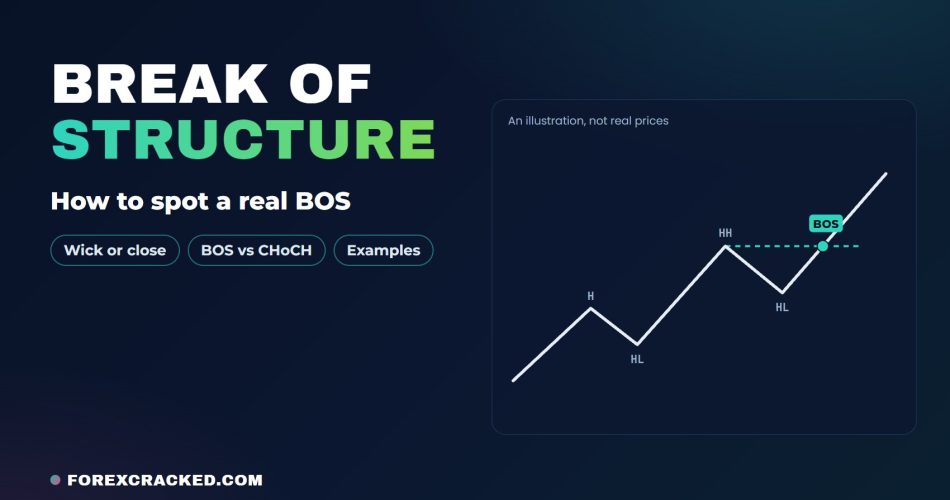
Price pushes through the last swing high. It looks like a break of structure, so you buy. Twenty minutes later price is back under the level and your stop is gone.
A break of structure is one of the simplest ideas in price action and smart money trading, and one of the easiest to misread. This guide covers what it is, how a bullish BOS differs from a bearish one, what separates a real break from a wick that snaps back, and how it compares with a change of character. You’ll also see how traders build entries around it, and a free way to check how breaks have played out on your own chart.
Key Takeaways
- A break of structure (BOS) is a candle closing beyond the last confirmed swing high in an uptrend, or the last confirmed swing low in a downtrend. It says the current trend is still in charge.
- A bullish BOS breaks a swing high and a bearish BOS breaks a swing low. The first break against the trend has its own name: a change of character (CHoCH).
- A common rule is to count a break only on a candle close. Under that rule, a wick that trades through the level and closes back inside is a liquidity sweep, not a break.
- A BOS reads the trend. It isn’t a trade on its own: traders usually wait for the pullback after the break and put the stop beyond the swing that set it up.
Table of Contents
What is a break of structure in trading?
A break of structure is the moment price closes past the swing point that defines the current trend. In an uptrend that’s the most recent swing high. In a downtrend it’s the most recent swing low. When a candle closes beyond it, price has printed a new higher high or a new lower low, and the trend’s structure is intact.
Traders shorten it to BOS, so BOS trading just means reading and trading those breaks, on forex pairs, gold, indices or crypto. The label comes from market structure analysis and is a core idea in ICT (Inner Circle Trader) and smart money concepts (SMC). Plenty of price action traders read charts exactly this way without using any of the acronyms.
One warning before the details. There’s no official rulebook here. Traders mark swings differently and argue about wicks and closes, so what follows is the common usage, with our own view where it matters.
Market structure in 60 seconds
Structure is the order of swing highs and swing lows on your chart:
- An uptrend prints higher highs (HH) and higher lows (HL).
- A downtrend prints lower highs (LH) and lower lows (LL).
- When neither pattern holds, price is ranging.
A swing high is a peak with lower prices on both sides of it, and a swing low is the reverse. The hard part is deciding which swings count. A two-candle wiggle on the 5-minute chart is a swing to someone. That’s why many traders mark structure on the timeframe they trade, ignore the small swings inside a leg (often called internal structure), and treat a swing as confirmed only once price has moved clearly away from it. Break one of those small swings and you get an internal BOS. Break the swing that defines the leg and it’s a swing, or external, BOS. This guide means the second.
Bullish and bearish break of structure
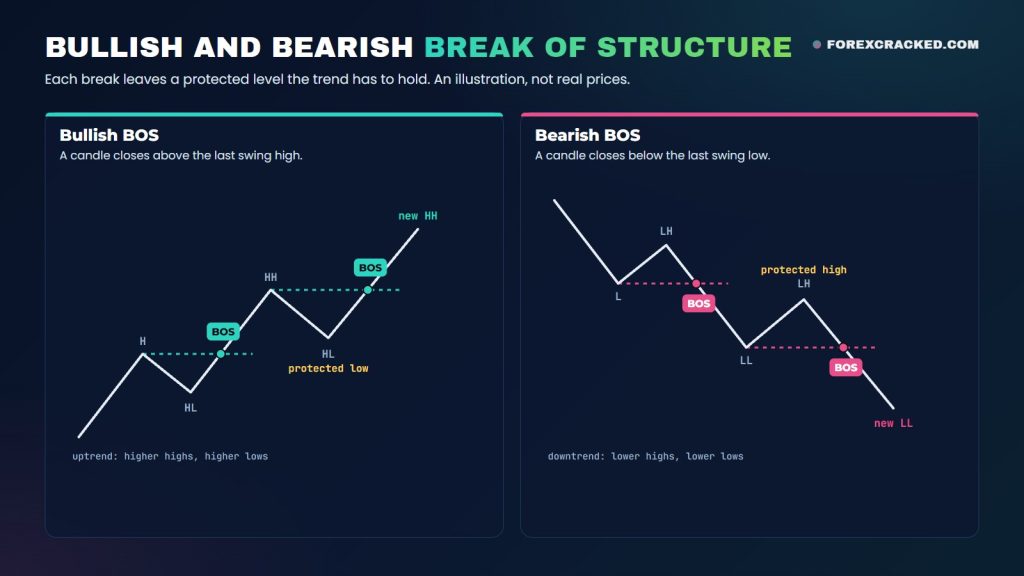
A bullish break of structure is a candle that closes above the last swing high in an uptrend. It makes a new higher high and tells you buyers still have control. You’ll also see it called a break of structure to the upside.
A bearish break of structure is the mirror image: a close below the last swing low in a downtrend, a new lower low, a break of structure to the downside.
Each break leaves a level behind it to defend. After a bullish BOS, the low of the pullback right before the break becomes the higher low the uptrend has to hold. SMC traders call it the protected low, or the strong low. While price stays above it, the uptrend stands. A close below it breaks the uptrend’s structure, and that’s a change of character.
How to identify a break of structure
Four steps, in this order:
- Mark the confirmed swings on the timeframe you trade. Skip the tiny wiggles inside a move.
- Read the trend from the sequence: higher highs and higher lows, or lower highs and lower lows.
- Find the level that matters. In an uptrend it’s the last swing high. In a downtrend it’s the last swing low.
- Wait for the close. A candle that closes beyond that level is the break of structure.
Then look at how it closed. Traders read a large candle that finishes well past the level, often called displacement, as a stronger break than a close that clears it by a pip or two, and some wait for that kind of close before they act.
Wick or close: when is a break of structure valid?
Traders argue about this one all the time. Does a wick through the high count, or do you need a candle close?
We count closes. A wick that trades through a swing high and closes back below it hasn’t broken anything. It ran the stops parked above the high and failed to hold there. That’s a liquidity sweep, and traders read it as a hint that the move may turn.
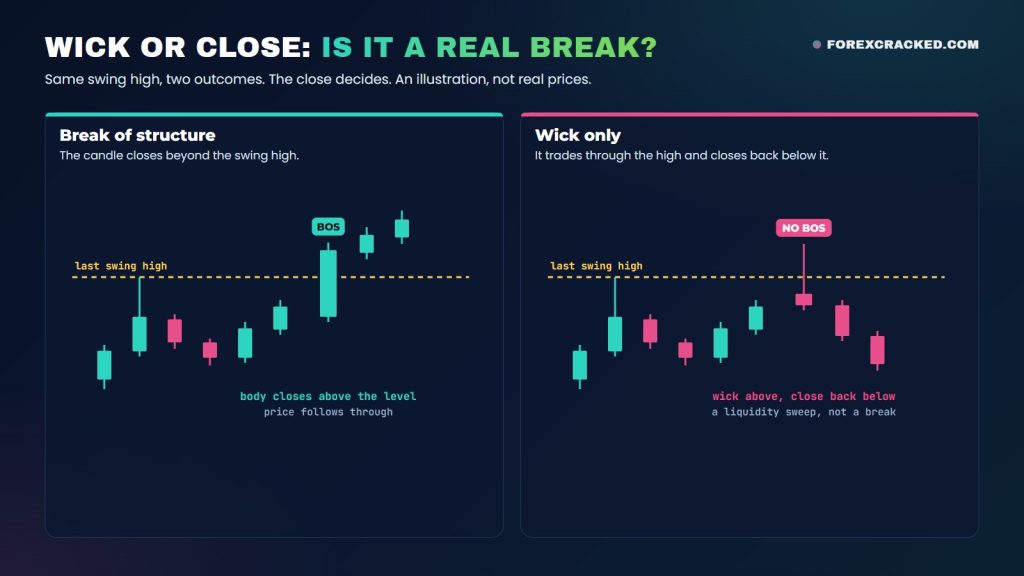
Two checks happen on the candle itself. It has to close beyond the level, not just poke a wick through, and the swing it breaks has to matter on your timeframe. The third check takes longer: a real break follows through. A fake break of structure passes the first two, then price drops straight back through the level.
You can’t tell which one you’ve got on the breakout candle. What you can do is see how often breaks like it have followed through on your chart, and that’s what our free indicator further down this page counts.
Break of structure vs liquidity sweep
The close tells them apart. A break of structure closes beyond the level, while a liquidity sweep trades through it, takes out the stops sitting there, and closes back on the other side.
In SMC teaching the two often arrive as a pair. Price sweeps a swing low, closes back above it, then rallies and closes above the last swing high. The sweep took out the sell stops and the BOS confirmed the move up. Our liquidity sweep indicator for TradingView flags the sweep half of that sequence on closed candles, at the swing highs and lows it tracks.
Change of character vs break of structure
A break of structure goes with the trend. A change of character (CHoCH) goes against it.
In an uptrend, a BOS is a close above the last swing high. A CHoCH is the first close below the last higher low. That’s the first sign the uptrend’s structure has failed, and traders read it as a possible reversal. In a downtrend it flips: a CHoCH is the first close above the last lower high.
Some SMC traders set the bar higher. They only call a CHoCH when price closes below the protected low, the higher low that set up the last BOS, and treat a break of a newer, smaller low as internal structure. Both readings are in common use, so check which one your indicator follows.
| Break of structure (BOS) | Change of character (CHoCH) | |
|---|---|---|
| Direction | With the trend | Against the trend |
| In an uptrend | Close above the last swing high | Close below the last higher low |
| In a downtrend | Close below the last swing low | Close above the last lower high |
| Usually read as | The trend continuing | The trend may be turning |
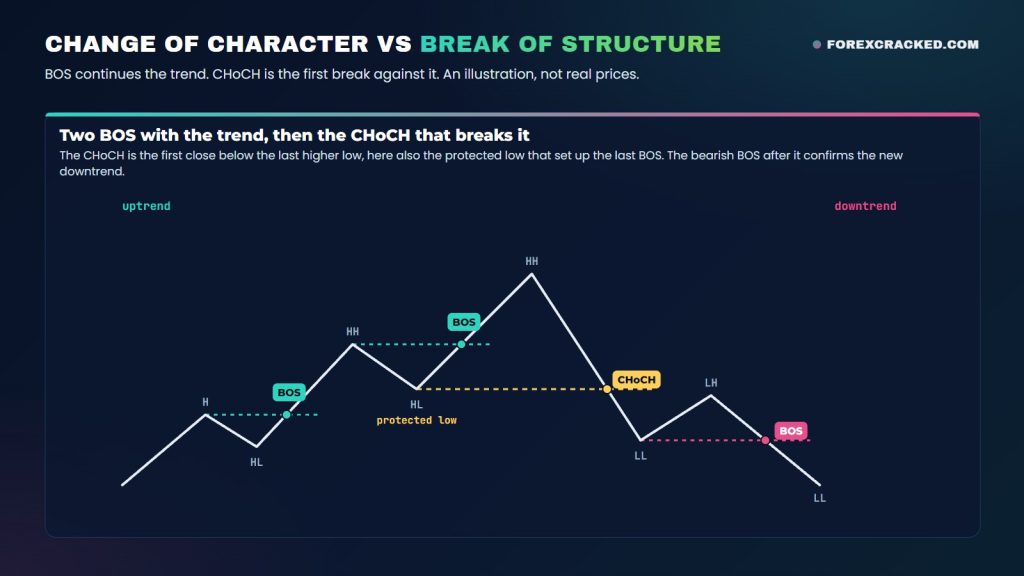
A CHoCH on its own is a warning, not a confirmed reversal. Many traders wait for the next break in the new direction, a bearish BOS after a bearish CHoCH, before they trade the turn.
BOS vs MSS (market structure shift)
You’ll also hear market structure shift, or MSS. It comes out of ICT teaching, and people use it in two ways. Some mean exactly what others call a CHoCH. Others keep MSS for a CHoCH that arrives with a strong, fast move. Either way it describes the trend changing, so it compares with a BOS the same way a CHoCH does.
Break of structure examples
Two patterns to look for, then a real chart with a break that failed and the change of character after it.
A BOS with the trend
In an uptrend, price makes a higher high, pulls back to a higher low, then a candle closes above that higher high. That’s a bullish BOS. In a downtrend it’s the mirror image: a close below the last lower low. Either way, the swing that set up the break becomes the level the trend now has to defend.
The break that wasn’t
Price spikes above the last swing high, but the candle closes back below it. No BOS: it swept the buy stops above the high. A few candles later price closes below the last higher low. That’s a CHoCH, the first sign the uptrend has lost its structure.
A real example: the BOS that failed, then the CHoCH
Here’s a break of structure example on real prices. It’s EURUSD on the 1-hour chart (FXCM prices) with our free BOS/CHoCH indicator for TradingView at its default settings (more on it further down). The screenshot was taken on Saturday 7 November 2026, so the last candle is Friday’s close at 1.11368. The chart’s clock is UTC+5:30, which is why Friday’s last few candles sit just past the 7 on the time axis.
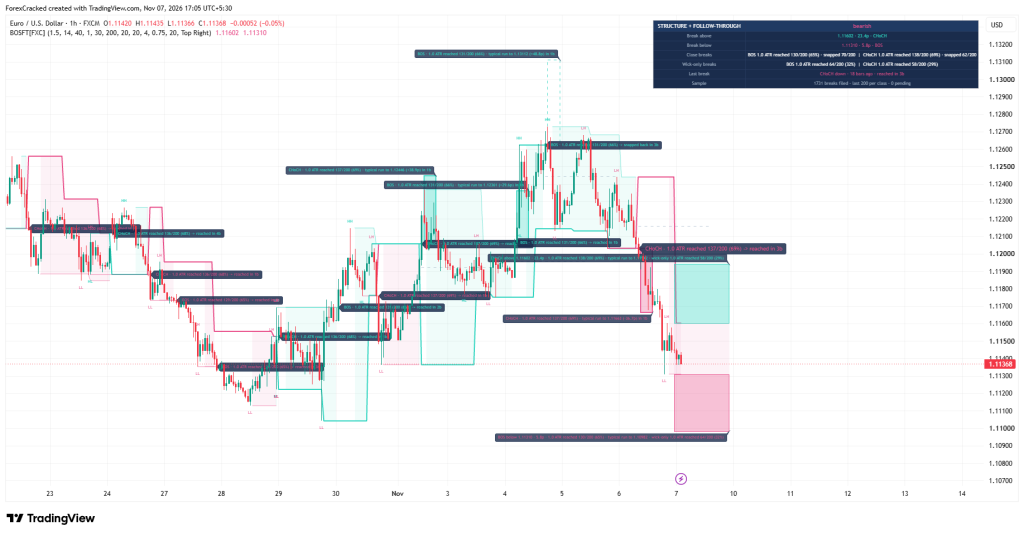
Read it from the top of the rally:
- The BOS that failed. On 4 November a candle closed above the swing high at about 1.1262, so the indicator printed a BOS with the uptrend. In the next 3 bars price fell 1 ATR back below the level, and it never got 1 ATR above it. The label now ends “snapped back in 3b”, and the tall dashed box above it is hollow, which is how the indicator marks a break that snapped back.
- The CHoCH. On 4 and 5 November price twice wicked under the latest swing low and closed back above it. Those dips are the two LL tags between the top and the CHoCH: sweeps, not breaks, so the indicator still read structure as bullish. Early on 6 November (UTC) a candle finally closed below the last swing low, at about 1.1203. That close is the change of character, the large CHoCH label in pink text, and it reached 1 ATR past the level in 3 bars.
- What would come next. The dashboard now reads bearish, and the newest LL and LH tags, at the right edge, are the next levels. A close below 1.11310, 5.8 pips under Friday’s close, would be the first bearish BOS since the CHoCH. A close above 1.11602, 23.4 pips higher, would be a CHoCH back to bullish.
How to trade a break of structure
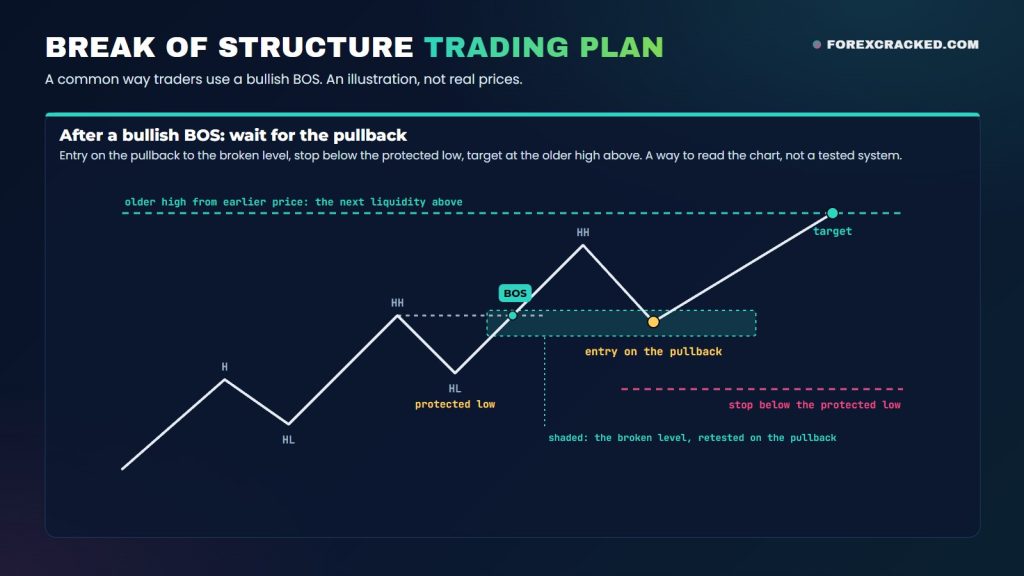
Break of structure trading comes down to one idea: a BOS tells you which side is in control, and you look for entries on that side. It doesn’t hand you an entry by itself. A common way to use it runs in four steps:
- Trade in the direction of the break. After a bullish BOS, look for longs. After a bearish BOS, look for shorts.
- Wait for the pullback. Chasing the breakout candle puts your stop a long way off. Many traders wait for price to come back to the broken level, an order block or a fair value gap the move left behind.
- Put the stop beyond the protected swing. For a long after a bullish BOS, that’s below the higher low that launched the break. If price closes below it, the idea is wrong anyway, because that close would be a CHoCH.
- Aim at the next liquidity: the next swing high, an older high, or another level where stops are likely to sit.
If you trade retests, our guide to breakout and retest setups walks through the pullback part in more detail. To mark the zones, try the order blocks indicator for MT4 and MT5 or our order block and FVG indicator for TradingView.
What’s the best timeframe for break of structure?
Structure shows up on every timeframe, and when two of them disagree, the usual rule is to give the higher timeframe priority. A bearish BOS on the 5-minute chart inside a strong 4-hour uptrend can be nothing more than a pullback in the bigger move.
A common way to stack them: read the trend on the 4-hour or daily chart, then wait for a BOS in the same direction on the 15-minute or 1-hour chart to time the entry. Lower timeframes print far more breaks, so you’ll see more noise there. If you scalp with BOS, check the higher timeframe first.
Did that break actually mean anything?
Every break of structure looks convincing on the candle that makes it. The useful question is what happened after breaks like it, on your symbol and your timeframe.
We built a free indicator for TradingView to answer exactly that: Market Structure BOS/CHoCH + Break Follow-Through. It tags confirmed swings as HH, HL, LH and LL, and labels every BOS and CHoCH on the candle that closes through a swing. Its CHoCH follows the common rule: the first close through the latest confirmed swing against the trend. Swings confirm by price, not by counting bars, and a close 1.5 ATR away from the swing (the default) confirms it, so the tags appear a few bars after the swing itself.
Then it keeps score. After each break it sets two finish lines the same distance from the level, 1 ATR beyond it and 1 ATR back through it, and records which one price touched first within 30 bars, or that it touched neither. It keeps those counts separately for BOS and CHoCH, and for close breaks and wick-only breaks, over the last 200 breaks of each kind.
The split shows how each kind of break behaved on your chart. On the EURUSD chart above, 130 of the last 200 BOS close breaks reached the finish line beyond the level first, and so did 138 of 200 CHoCH close breaks. For wick-only breaks it was 64 (BOS) and 58 (CHoCH) of 200.
Read those numbers with one thing in mind: they count follow-through, not winning trades. A close break starts the count already past the level, and a wick-only break starts back inside it, so close breaks get a head start toward the far line. Some or all of the gap between close and wick-only breaks is built in, so it’s no proof that waiting for the close pays. Percentages only print once a class has at least 20 breaks, and they describe past breaks on that chart, not the next one.
New to community scripts? Here’s how to install TradingView custom scripts, step by step.
Prefer MetaTrader?
On MetaTrader, there’s a free BOS and CHoCH indicator for MT4 and MT5 that labels breaks of structure and changes of character on the chart for you. The Market Structure Oscillator shows shifts and breaks in structure across short, intermediate and long term swings. You’ll find the rest in our market structure indicators collection.
Frequently Asked Questions
Check breaks on your own chart
Want to know how breaks of structure have played out on the symbol you trade? Add Market Structure BOS/CHoCH + Break Follow-Through to your TradingView chart and read the counts before you trust the next break.
Risk disclaimer: This article explains a way of reading price charts. It isn’t a trading system and doesn’t predict price. The counts our indicator prints describe past breaks on one chart, without spread, commission or slippage. This is shared for educational purposes and is not financial advice.


Discussion no comments yet
Nothing here yet
No one has asked anything about Break of Structure : What It Is and How to Spot a Real One yet. First question gets answered.