

Most lists of the best MT5 indicators tell you what each one does, and none we read showed a test. So we tested ten free ones: five FXC indicators we build ourselves, two each from PointZero Trading (PZ) and FXSSI, and MT5’s own ATR. We loaded them in MetaTrader 5 and replayed the 1-hour EURUSD chart from 2 to 20 November 2026 one candle at a time, with gold added for seven of them. At every close we recorded what each indicator showed, then checked whether any closed candle’s value or arrow changed later. That’s repainting, and it’s the first thing traders ask about under any free indicator.
Each of the ten does a different job, and no two are the same kind of indicator. The list runs by job, not by who made it, and every entry says where it falls short.
Key Takeaways
- Our repaint replay caught MT5’s own ZigZag in the act: of the 109 swing points it showed at a candle’s close, 87 had been taken back by the end. That’s how we know the test catches a redraw after the close.
- Across all ten, nothing our replay read on a closed candle changed later, except one line: FXC Super Trend’s, redrawn one candle back to join up at each turn. Its arrows never moved, and neither did any PZ or FXSSI signal.
- PZ Reversal Fractals stays put by waiting: each of its signals was set four candles after the swing low or high it marks. The arrow sits on the swing itself, so on a live chart it appears beside a candle that closed four candles earlier.
- FXSSI’s TRIX Crossover crossed 36 times on EURUSD H1 in our three weeks, against 22 turns for FXC Super Trend on the same candles, so expect more signals and more flips from it.
- Of the ten, only ATR runs in the MT5 phone app. The nine downloads need MetaTrader 5 on a computer or a VPS.
Table of Contents
The best MT5 indicators at a glance
Here are the best MetaTrader 5 indicators from our test in one table, with what the replay found for each.
| Indicator and what it’s for | What our replay found |
|---|---|
| 1. ATR, built in: stop size | No change; 6.9 to 23.8 pips on EURUSD H1 |
| 2. FXC Super Trend: trend and trailing stop | 36 arrows on EURUSD and gold, none moved; the line joins one candle back at each turn |
| 3. TRIX Crossover, FXSSI: momentum crosses | 65 crosses on EURUSD and gold, none moved |
| 4. FXC Super RSI: RSI on nine timeframes | No value changed on 360 candles |
| 5. PZ Reversal Fractals: swing turns | 12 signals on EURUSD and gold, none moved; each set four candles after its swing |
| 6. FXC VWAP Bands: intraday stretch from VWAP | 62 arrows on EURUSD and gold, nothing changed |
| 7. Volume Candlesticks, FXSSI: tick volume | No candle’s shade changed on 360 candles |
| 8. PZ Inside Bars: breakouts | 56 breakouts on EURUSD and gold, none moved |
| 9. FXC Supply and Demand: zones and pressure | Pressure line unchanged on 705 candles of EURUSD and gold |
| 10. FXC Pivot Points: daily, weekly and monthly levels | No level changed on 360 candles |
| The control, MT5’s ZigZag | 87 of 109 swing points taken back |
Replayed in MetaTrader 5 on the 1-hour EURUSD and gold charts, 2 to 20 November 2026. Single counts are EURUSD.
How we tested
- Platform: MetaTrader 5 (build 6230) with an IC Markets demo price feed. We only read prices; nothing was traded.
- Charts: EURUSD H1 for all ten. Gold (XAUUSD) H1 as well for Super Trend, VWAP Bands, Supply and Demand, ATR, PZ Reversal Fractals, PZ Inside Bars and TRIX Crossover.
- Period: the replay ran from 2 to 20 November 2026 and read 360 closed EURUSD candles and 345 on gold, from the last candle of 30 October to the 22:00 candle on 20 November.
- Files: each FXC indicator from its own download (version 1.00, the zip a reader gets), default settings. Screenshots use the chart template from the same zip. The PZ and FXSSI indicators are the current free versions from their developers’ own sites (21 November 2026: TRIX.Crossover 1.07 and Volume Candlesticks 1.08 from FXSSI), at their default settings with no template. MT5’s own indicators ran at the settings named in their entries, in MT5’s default chart colours.
- The replay: MT5’s Strategy Tester ran a small test EA of ours over the period. Each time a candle closed, it read every value the indicator had on that candle, which is what you’d have seen live. At the end it read the same candles again. Any candle whose value or arrow had changed counts as a change.
- The control: before trusting the test, we ran it on MT5’s own ZigZag, which redraws its last leg by design. The test caught it: the ZigZag line changed on 88 of the 360 candles.
- A pass: no arrow and no value changing after its candle closed. A line drawn one candle back to join two segments doesn’t fail, because no signal moves, but we report it (Super Trend does this).
- What it can’t see: an arrow that flashes on the live candle and is gone before the close never reaches a closed candle, so a closed-candle test can’t catch it. The two FXC indicators here that draw arrows, Super Trend and VWAP Bands, print them only once the candle has closed, as their code and the Foundry announcement say. We can’t read the PZ and FXSSI code. PointZero says both of its indicators don’t repaint, FXSSI says the same of TRIX Crossover, and the replay agreed on every closed candle it read. It reads the values an indicator stores, not shapes drawn on the chart: PZ Reversal Fractals draws its arrow back on the swing candle, four candles after that candle closed.
- Not tested: whether any of them makes money. Three weeks can’t tell you that, and none of these is a trading system on its own.
What the five FXC indicators have in common
- Each one is a single zip with the MT4 and MT5 versions, a chart template and a quick start guide.
- Each puts a dashboard on the chart that you can shrink or switch off.
- All five can send alerts, though Pivot Points’ are off until you turn them on.
- They need Allow DLL imports in MT5, as their own install steps say. Nothing extra gets installed.
- They run on demo and live accounts with no key, no sign-up and no email.
- None of them runs in the MT5 phone app: you need MetaTrader 5 on a computer or a VPS.
About the PZ and FXSSI picks
- These four are free from PointZero Trading’s and FXSSI’s own sites: PointZero emails you a download link, and FXSSI’s downloads need no registration.
- Each is a single compiled file with no chart template, so we ran them at their default settings. What we say about them comes from our replay and their developers’ own pages.
1. ATR: the stop-size indicator already in MT5
ATR (Average True Range) measures how far price usually travels in one candle, gaps included. It doesn’t tell you which way. What it does tell you is how much room a stop needs to sit outside a normal candle’s noise, and it’s already installed. That’s why we’d call it the most practical free indicator in MT5.
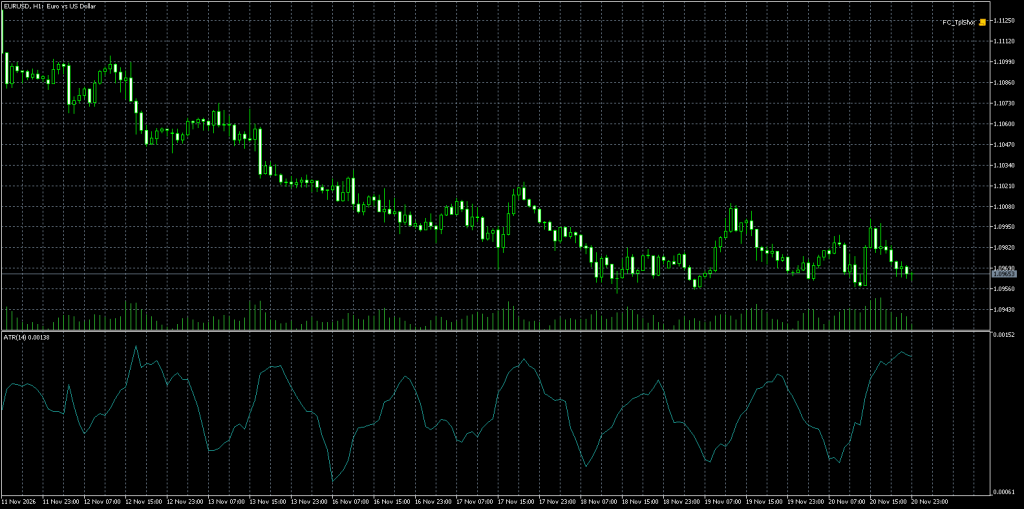
What our test showed. On EURUSD H1, ATR 14 ran from 6.9 to 23.8 pips over the three weeks, with a median of 11.6, and no closed candle’s value changed later. That range is why fixed stops break down: a 10-pip stop was wider than a typical candle at the quietest point and well inside one at the busiest.
Worth knowing. MT5’s ATR is a plain average of the last 14 true ranges, which you can read in MetaQuotes’ own code in the MQL5\Indicators\Examples folder. TradingView’s ATR uses Wilder’s smoothing by default (its settings call it RMA), and switching that setting to SMA makes it work like MT5’s. So the same 14 gives a slightly different number on each platform: MT5 drops a big candle completely after 14 candles, while TradingView lets it fade out slowly.
Use it if you set stops or position sizes by hand. Skip it if you want a direction; ATR has none.
It’s already in MT5 under Insert › Indicators › Oscillators › Average True Range.
2. FXC Super Trend: a trend line that doubles as a trailing stop
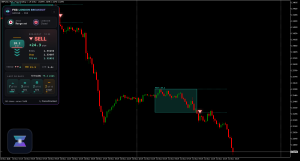
FXC Super Trend, one of the indicators we build, draws one line under price in an up-trend and one above it in a down-trend, and each line only moves your way, so it doubles as a trailing stop. The trend turns down when the average of the last two highs drops under the trigger level, the highest of the up-trend’s lowest lows, and a candle closes below the previous candle’s low. A turn up is the mirror of that. Each turn prints an arrow on the closed candle, and the panel shows how long the trend has run, how far the stop line is in pips, and what would have to happen for the next turn.
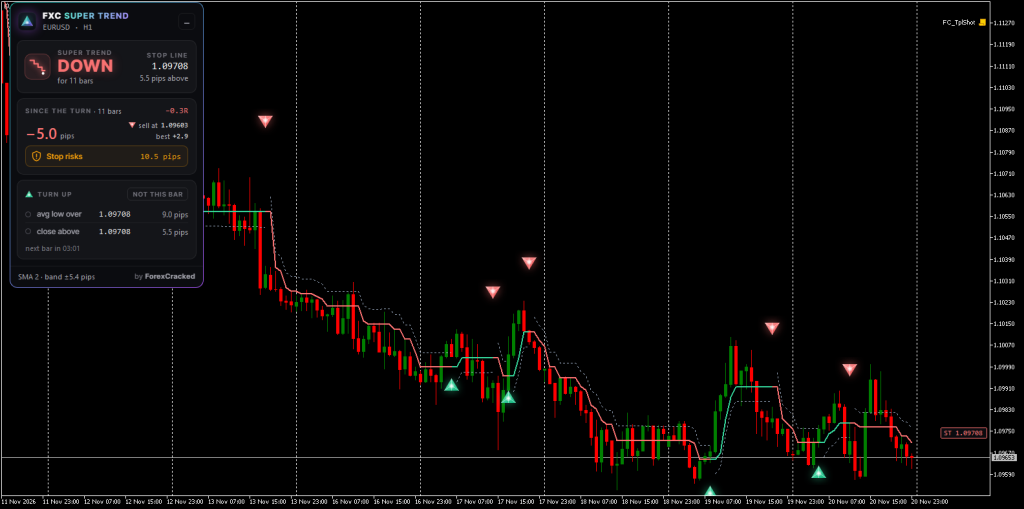
What our test showed. On EURUSD H1 it turned 22 times in three weeks, 11 each way, and none of the 22 arrows moved after its candle closed. On gold it turned 14 times, again with no arrow moving.
The lines themselves did change on 22 candles (14 on gold), and every one of those was the candle just before an arrow: at each turn, the new line is drawn one candle back so it joins the old one. It’s a cosmetic join, not a moved signal. Still, it’s why the line can look like it knew about a turn one candle early when you scroll back.
One thing the download page doesn’t say. It works out its whole history again on every tick. Our replay of three weeks of EURUSD took 9 minutes with Super Trend, against 7 seconds for VWAP Bands on the same candles. On one chart you probably won’t notice. On a small VPS running twenty charts, you might.
Use it if you trade with the trend on H1 or higher and want a stop that only moves in your favour. Skip it if you trade ranges. It turned 22 times in 15 trading days on EURUSD H1, about one and a half times a day, and a sideways market would likely turn it more. And if all you want is the trend’s direction, MT5’s own moving average shows that without a download.
MT5 has a trailing line of its own, too: Parabolic SAR, which MetaQuotes’ help says often serves as a trailing stop. It wasn’t part of this test.
Download FXC Super Trend for MT4 and MT5, free with no sign-up. Our full review of this Supertrend indicator for MT4 and MT5 goes through its settings.
3. TRIX Crossover by FXSSI: momentum crosses, marked at the close
TRIX is a triple-smoothed exponential moving average turned into a rate of change, so the small wiggles drop out and what’s left is momentum. TRIX.Crossover, a free indicator from FXSSI, draws it with a signal line in its own window and marks each candle where the two lines cross.
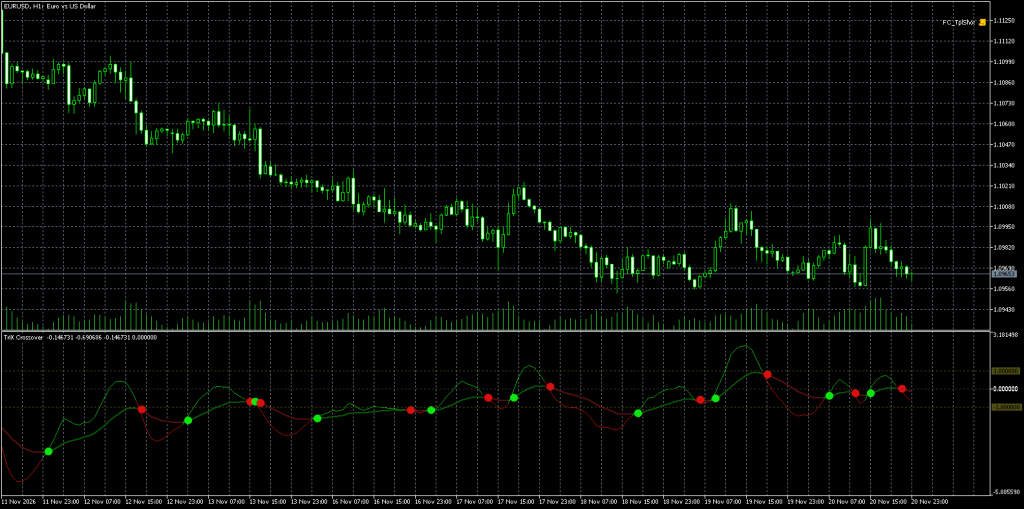
What our test showed. The two lines crossed 36 times on EURUSD H1 in our three weeks, 18 each way, and 29 times on gold. Every cross was marked at the close of the candle where it happened, and none of its values or marks changed later.
Worth knowing. That’s more than two crosses a trading day, against 22 turns for FXC Super Trend on the same EURUSD candles. More crosses means more entries, and more times you’re flipped out.
Use it if you trade short swings and want a momentum signal you can read at a glance. Skip it if you hold trends for days. It will cross against you many times on the way.
Download TRIX.Crossover for MT4 and MT5 free from FXSSI’s site, with no registration.
4. FXC Super RSI: an RSI indicator for MT5 that reads nine timeframes
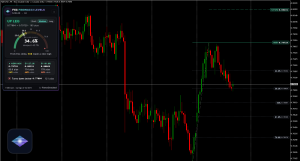
FXC Super RSI, another of ours, is an RSI with one twist: the period follows the timeframe. It uses RSI 7 on M1, 9 on M5, 14 on M15 and M30, 21 on H1, 28 on H4 and the daily chart, 34 on the weekly and 50 on the monthly, with 70 and 30 as the levels on each. The line changes colour in the overbought and oversold zones, and the panel shows the reading on all nine timeframes at once, so you can see when M15, H1 and H4 are stretched the same way.
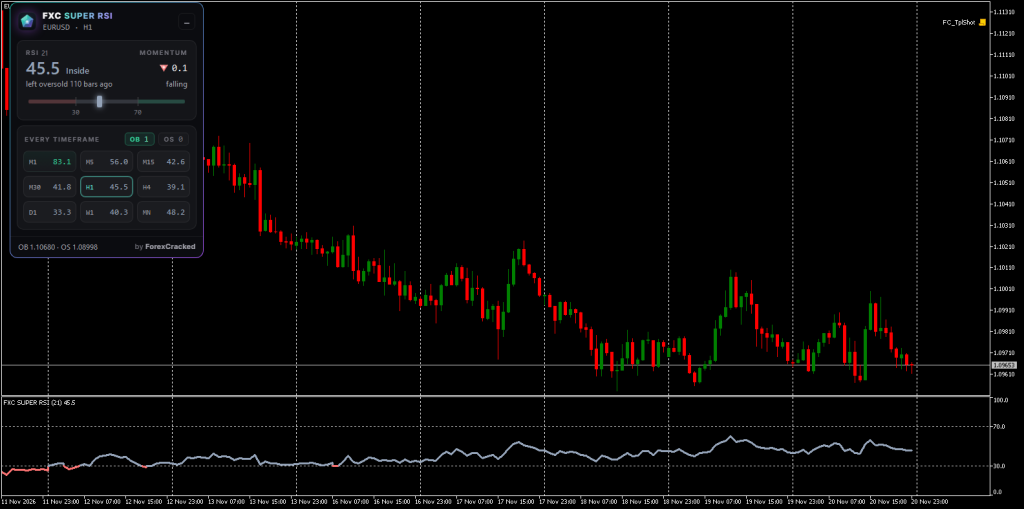
What our test showed. EURUSD fell about 185 pips in our three weeks, and RSI 21 on H1 closed below 30 on 17 candles and above 70 on just 2, against 47 and 11 for MT5’s own RSI 14. A longer period moves more slowly. No RSI value changed after its candle closed.
Worth knowing before you install. Because H1 uses RSI 21, its numbers won’t match the RSI 14 on another platform or in MT5’s own RSI. Neither is wrong. A longer period moves more slowly and reaches 70 or 30 less often. If you want the standard 14, change the H1 period in the settings.
Use it if you use RSI to judge whether a move is stretched on more than one timeframe. Skip it if you only need one RSI on one chart. MT5’s built-in RSI does that.
Download FXC Super RSI, a multi-timeframe RSI for MT4 and MT5, free.
5. PZ Reversal Fractals: swing turns, confirmed before they print
A fractal is a swing low or high that can only be confirmed once a few more candles have closed. PZ Reversal Fractals, a free indicator from PointZero Trading, waits for that confirmation and then marks the turn with an arrow at the swing.
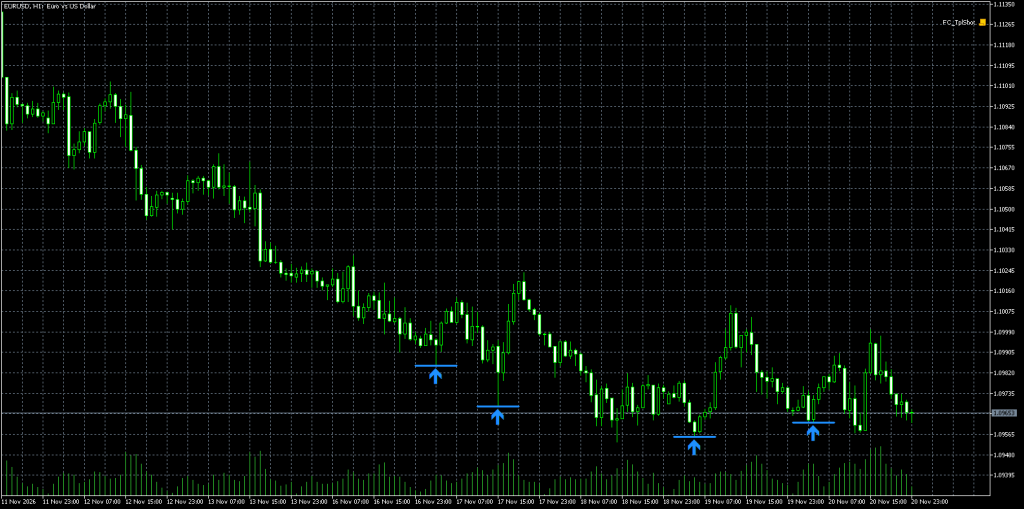
What our test showed. Six signals on EURUSD H1 in three weeks (five buys, one sell) and six on gold (four buys, two sells). None of its signals moved or vanished, and each was set at the close of its own candle, four candles after the swing it marks: the swing low or high was always the fourth candle back.
Worth knowing. Fractal indicators are the classic repainting suspects, because a swing can’t be known until later candles close. This one avoids that by waiting, which also makes it late. The signal behind each arrow never changes, but the arrow is drawn back on the swing candle, so on a live chart it appears on a candle that closed four candles earlier. By the strict test in our FAQ that’s a drawing placed on an old candle. It’s always exactly four candles back, though, so read it as late rather than redrawn, and go by the time it showed up, not where it sits.
Use it if you want a few confirmed swing points to trade from or set stops behind. Skip it if you need early entries or a trend signal. It calls turns: five of its six EURUSD signals were buys while EURUSD fell about 185 pips, and we didn’t measure how those trades went.
PZ Reversal Fractals is free from PointZero Trading; their site emails you the download link.
6. FXC VWAP Bands: a VWAP indicator for MT5 that measures the stretch
VWAP is the day’s average price weighted by volume, and plenty of intraday traders treat it as the day’s fair value. MT5 has no exchange volume for forex, so the calculation uses tick volume, the number of price changes in each candle.
FXC VWAP Bands, which we build, draws the line with a band two standard deviations either side. It prints a buy arrow when a candle’s low reaches the lower band and the candle before it stayed clear of the band, and a sell arrow at the upper band the same way. No arrows print while the bands are squeezed. The panel shows how far price has stretched from VWAP in pips and where the next arrow would print.
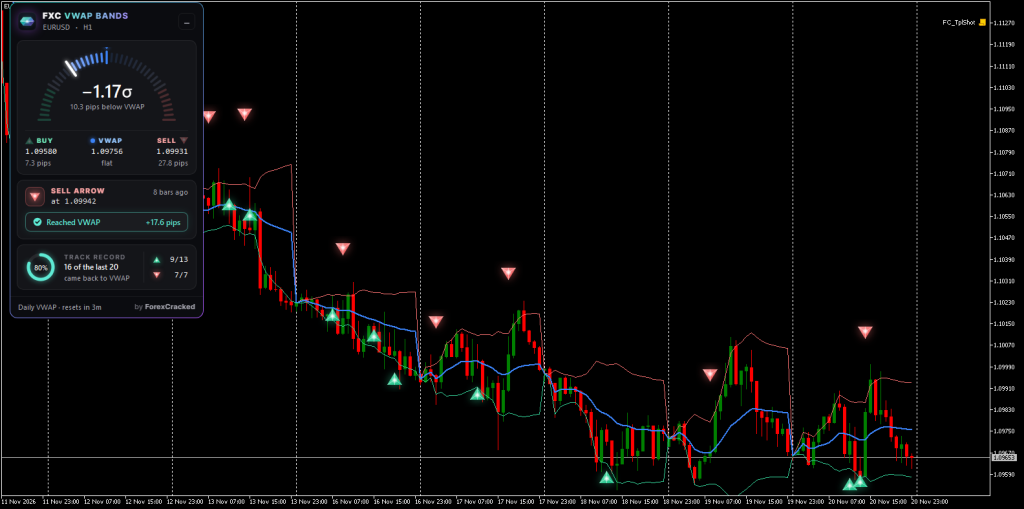
What our test showed. Nothing it drew on a closed candle changed later. Not the VWAP line, not the bands, and not one of the 34 EURUSD arrows (22 buys, 12 sells) or the 28 on gold (23 buys, 5 sells). An arrow only appears once its candle has closed, which is what the code says it does.
We also checked what price did next, from the same three weeks of candles. On EURUSD, 24 of the 34 arrows saw price trade back to VWAP before the day ended: 11 of the 12 sells, but only 13 of the 22 buys. EURUSD fell about 185 pips over those weeks, so the buys were leaning against the move. On gold, 16 of the 26 arrows with candles left in their day got back to VWAP. Three weeks is a small sample, so read this as how the arrows behave, not as an edge.
One thing the download page doesn’t say. How far price runs against an arrow before it gets back. The panel’s record leaves that out on purpose, and our replay measured it: on the 13 EURUSD buys that got back to VWAP, price first went a median 6.2 pips the wrong way from the arrow candle’s close, and 30.8 pips at worst.
Use it if you trade M5 to H1 and want to know when price has stretched far from the day’s average. Skip it if you trade H4 or daily charts, where the daily VWAP pauses and only an anchored one draws, or you want a trend signal: every arrow here bets on a move back toward VWAP. For a plain read of how far price has stretched, MT5’s own Bollinger Bands are enough.
Download the FXC VWAP Bands indicator for MT4 and MT5, free.
7. Volume Candlesticks by FXSSI: tick volume painted on the candles
Volume Candlesticks, a free indicator from FXSSI, recolours the candles themselves in shades by tick volume, so the busy candles stand out without a volume window.
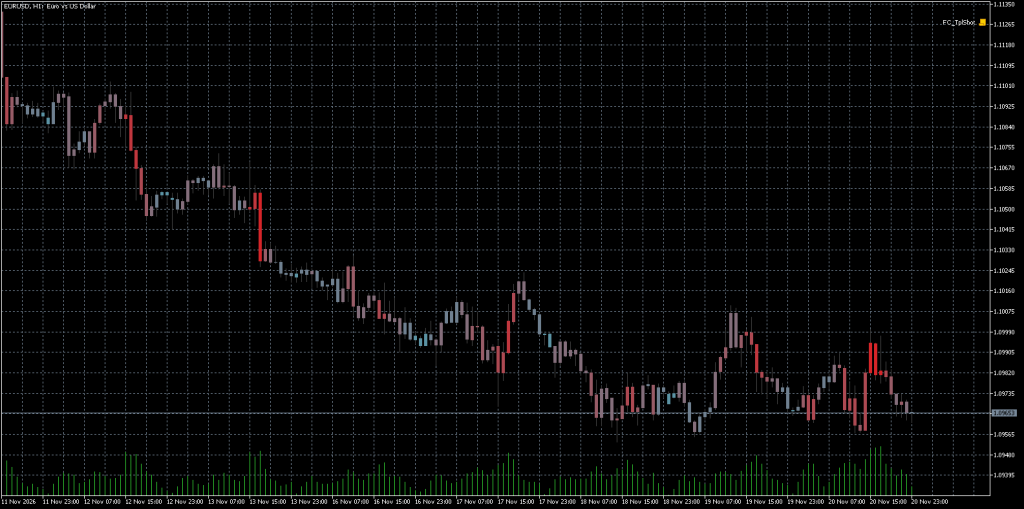
What our test showed. It gave each of the 360 candles one of eight shades, and the shades followed tick volume: the 19 candles in the top three shades, 5% of the 360, had a median of 5,366 ticks, against 2,125 for all 360. No candle’s shade changed after it closed.
Worth knowing. Tick volume is your broker’s count, not the whole market’s, so another broker’s chart shades differently. Compare a candle with the ones around it on the same chart, which is what the shading does for you.
Use it if you want to see where the market was busy, such as a breakout on heavy ticks or a drift on light ones. Skip it if you already run a volume window. This shows the same ticks, just on the candles.
Download Volume Candlesticks for MT4 and MT5 free from FXSSI’s site, with no registration.
8. PZ Inside Bars: breakouts from an inside-bar pause
An inside bar is a candle that stays within the previous candle’s high and low, a pause before the next move. PZ Inside Bars, a free indicator from PointZero Trading, boxes each formation and signals a breakout only after a candle closes beyond it. PointZero’s own key: a green box while it waits, blue for a breakout up, red for down.
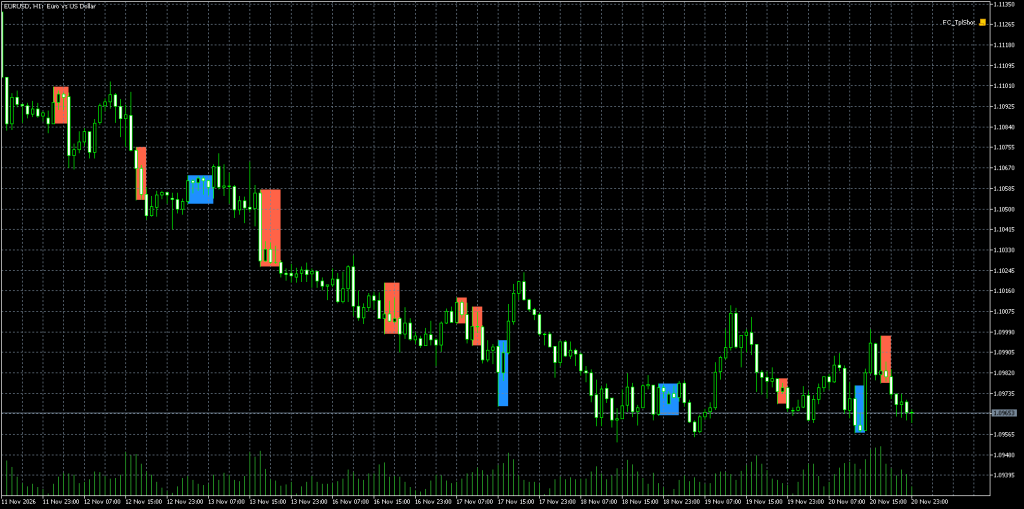
What our test showed. It flagged 26 breakouts on EURUSD H1 in three weeks, 11 up and 15 down, and 30 on gold. Every flag was set at the close of its candle, and none of its values changed later.
Worth knowing. On H1 that’s almost two breakouts a trading day, so you’ll need a way to choose. PointZero itself suggests pairing it with support and resistance or a trend filter, and we’d agree.
Use it if you trade price action and want inside-bar breakouts found and boxed for you. Skip it if you want fewer, bigger signals. On H1 it fires often.
PZ Inside Bars is free from PointZero Trading; their site emails you the download link.
9. FXC Supply and Demand: zones plus a pressure gauge
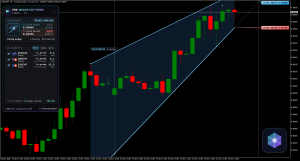
FXC Supply and Demand, also ours, finds zones from strong candles, ones with a body bigger than the ATR, over the last 300 candles. It draws the latest unbroken supply above price and demand below it, and adds a pressure line in its own window: 0 means price is at demand and 100 means it’s at supply, and it can drop below 0, as it did on 6 EURUSD candles in our replay.
The panel is an hourglass filled to that pressure, with the two zones beside it and a row showing the same reading on this timeframe and the three above it. An alert fires once when a candle closes with the pressure crossing down through 20 (into demand) or up through 80 (into supply).
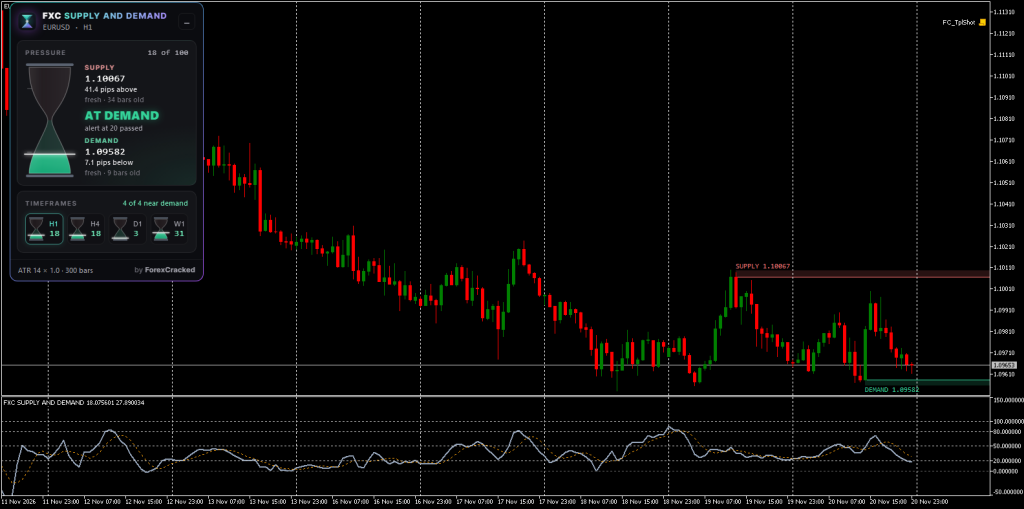
What our test showed. The pressure line and its signal line never changed on a closed candle, on EURUSD (360 candles) or on gold (345). The zones on the main chart are drawn shapes, which our replay doesn’t read. They change as new zones form and old ones break, which is what zones are meant to do.
Worth knowing before you install. The timeframes row goes up from your chart, not down: on H1 it shows H1, H4, D1 and W1, and from D1 up it always shows H4, D1, W1 and MN. An M1 zone is usually only about 15 minutes old, so the lower timeframes were left out on purpose.
Use it if you trade pullbacks into zones and want one number that says how close price is to each side. Skip it if you want every old zone on the chart. It shows one supply zone and one demand zone, the latest unbroken ones, and that’s all.
Download the FXC Supply and Demand zones indicator for MT4 and MT5, free.
10. FXC Pivot Points: day, week and month in one place
FXC Pivot Points, the last of our five, works out the pivot (PP), three resistance levels (R1 to R3) and three supports (S1 to S3) from the last period’s high, low and close. It offers the Classic, Fibonacci, Woodie and Camarilla methods, and Camarilla adds R4 and S4. The period follows your chart: daily pivots up to H3, weekly up to H8 and monthly above that, and you can click the day, week or month on the panel to switch. The panel shows where price sits between the levels and how far the next one is.
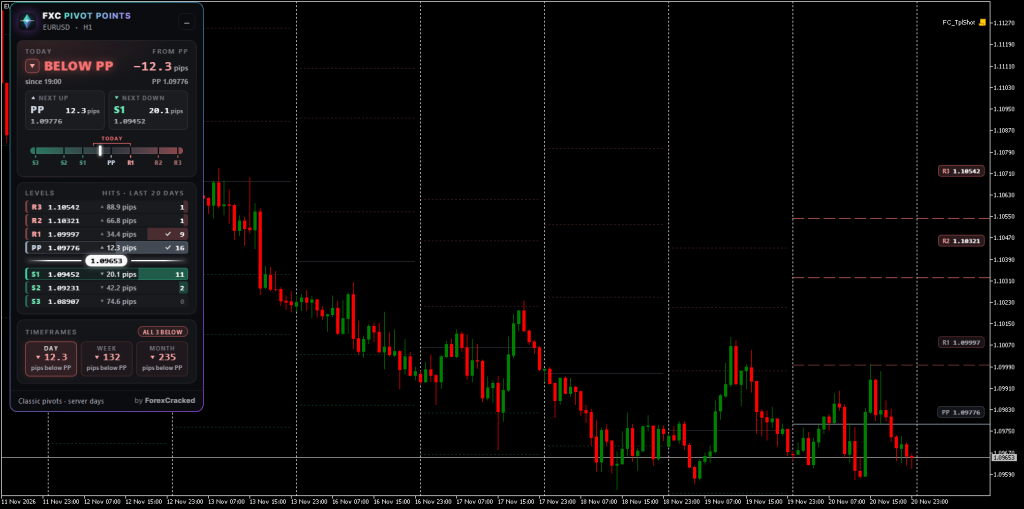
What our test showed. None of the levels changed on a closed candle in the three weeks on EURUSD H1, which is what you want from pivots: they’re set when the period opens and stay put until the next one. We left Day Starts At on its default of 0, because the IC Markets day already ends at the New York close (its server runs on GMT+2, or GMT+3 in summer). If your broker’s day starts at midnight GMT, set it to 22, or 21 in summer.
One thing the download page doesn’t say. Price usually reached R1 or S1, but almost never both. Over our 15 trading days, EURUSD reached the daily R1 on 6 and S1 on 8, at least one of the two on 13, and both on just one.
Use it if you trade intraday and like fixed levels you can plan around before the session opens. Skip it if you hold trades for days: on H4 and up the default period turns weekly or monthly, and the levels change rarely.
Download FXC Pivot Points, a pivot point calculator for MT4 and MT5, free.
Already in MT5: four more we tested
Like ATR, these four come with MetaTrader 5. Each does much the same job as one of the ten (the moving average as Super Trend, RSI as Super RSI, MACD as TRIX Crossover, Bollinger Bands as VWAP Bands), so they’re not on the list, but we ran them through the same replay. None changed a closed candle.
Moving Average. From 2 to 20 November, the close switched sides of a 50-period simple average 20 times, against 22 turns for FXC Super Trend, and of a 20-period exponential one 42 times. It gives you a direction and nothing more: no arrow, no alert, no stop. It’s under Insert › Indicators › Trend › Moving Average.
RSI. RSI 14 closed below 30 on 47 candles and above 70 on 11 while EURUSD fell, so oversold stayed oversold. MT5’s RSI uses Wilder’s smoothing, the method TradingView’s help gives for its own RSI: we rebuilt MT5’s numbers from the closes and they matched to four decimal places. It’s under Insert › Indicators › Oscillators › Relative Strength Index.
MACD. MT5 draws the MACD line itself as grey bars, not MACD minus the signal, and its signal line is a 9-period simple average. On TradingView the bars are MACD minus the signal, and the signal line can be exponential or simple, so a strategy written for TradingView’s MACD won’t line up. It’s under Insert › Indicators › Oscillators › MACD.
Bollinger Bands. At 20 periods and 2 standard deviations, as MetaQuotes’ help recommends, the bands were 18.4 to 130.8 pips apart on EURUSD H1 (median 53.7), and price closed outside them on 46 of the 360 candles. It’s under Insert › Indicators › Trend › Bollinger Bands.
The one that failed our test: MT5’s own ZigZag
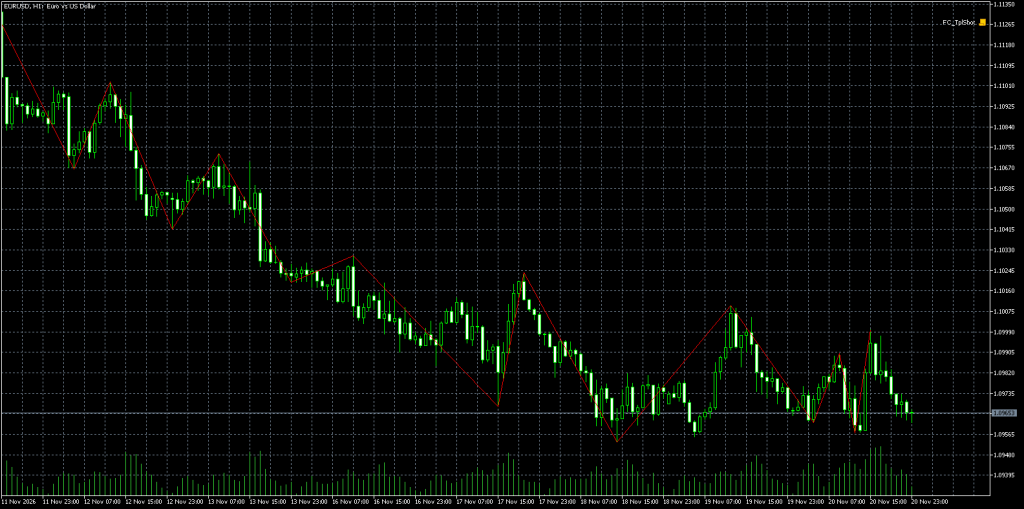
ZigZag comes with MT5 in its Examples folder, and it’s the textbook repainting indicator. It joins the last swing high to the last swing low, and until price has turned far enough, it keeps moving that last point. We used it as the control for our replay, and it failed exactly the way it should.
On EURUSD H1, 88 of the 360 closed candles showed a different ZigZag value at the end of the three weeks than they did at the moment they closed. Of the 109 swing points it showed live, 87 were taken back later, and one swing point appeared on a candle that had already closed.
That doesn’t make ZigZag useless. It’s fine for marking past swings when you study a chart. It’s the wrong thing to take signals from, and so is any download that quietly builds its arrows on it.
How to install an MT5 indicator
Every FXC download is one zip with the MT4 files, the MT5 files, a chart template and a quick start guide in PDF. For MT5:
- In MetaTrader 5, open File › Open Data Folder, then close MetaTrader.
- Copy everything inside the zip’s MT5 folder into that data folder. The indicator file lands in MQL5\Indicators and the template in MQL5\Profiles\Templates.
- Open MetaTrader again, press Ctrl+O to open its Options, and on the Expert Advisors tab tick Allow DLL imports. FXC indicators need it, and nothing extra gets installed.
- Open a chart, right-click it, choose Templates and pick the indicator’s name.
The PZ and FXSSI indicators are a single .ex5 file each for MT5 (FXSSI’s comes in a zip, so unzip it first): put it in MQL5\Indicators inside the data folder, then restart MT5. ATR and the four in “Already in MT5” need none of this: they’re under Insert › Indicators.
If an indicator doesn’t show up, our step-by-step guide with pictures covers how to install indicators in MT4 and MT5.
More free MT5 indicators on ForexCracked
Want a longer MT5 indicators list? These are free on ForexCracked too:
- More than 100 free MT5 indicators in one collection, from arrows to dashboards.
- Non-repaint MT5 indicators, if repainting is your main worry.
- On MT4 instead? Our list of the 10 best free MT4 indicators.
- For smart money charts there’s a free order blocks indicator for MT4 and MT5 and a free BOS and CHoCH indicator on our site. We didn’t build them and haven’t put them through this test, so they’re not on the list.
- Three more FXC indicators were in our test but didn’t make the ten. The FXC Trend Radar dashboard for MT4 and MT5 draws only a panel, and the FXC Support and Resistance indicator for MT4 and MT5 a panel and lines, so neither keeps values our replay could read. FXC MA Crossovers, a moving average crossover indicator for MT4 and MT5 passed the replay, with none of its 15 arrows moving, but the ten already have a trend indicator in Super Trend. All three are free.
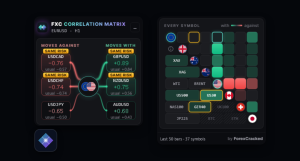
- The other six free FXC indicators are in the FXC Foundry: London Breakout, Correlation Matrix, Super Bands, Boll Bands Trader, RSI Flow and Currency Strength. Currency Strength isn’t on this list because it reads 28 pairs at once, and in MT5’s Strategy Tester it showed no reading at the close of 358 of the 360 candles, so our replay couldn’t check it.
Frequently Asked Questions
Conclusion: where to start
You don’t need a download to start: ATR tells you how much room a stop needs, and MT5’s moving average shows you the trend. If you add one download, make it FXC Super Trend, one of ours, on H1 or higher. It turned about as often as the 50-period average in our replay, but it adds a trailing stop line and an arrow at each turn. Every download here passed the same replay, so choose the rest by the job you need.
Trade short swings? FXSSI’s TRIX Crossover signals more often than Super Trend, 36 crosses to 22 turns on EURUSD. PZ Reversal Fractals gives a few confirmed swing points, and PZ Inside Bars boxes inside-bar breakouts for you (almost two a day on H1, so pair it with a filter).
Trading intraday on M5 to H1? Add FXC VWAP Bands, and watch which side of the day’s trend its arrows are on. Add Supply and Demand if you trade pullbacks into zones, and Pivot Points if you like fixed levels to plan around. Super RSI reads RSI on nine timeframes at once, and FXSSI’s Volume Candlesticks shows the busy candles without a volume window. Keep ZigZag for marking old swings, never for signals.
Risk disclaimer: This article compares free indicators. It isn’t a trading system and doesn’t predict price. Our replay checked whether the ten indicators change what they showed on closed candles; it didn’t measure profit, and three weeks on two markets can’t tell you what comes next. We build the five FXC indicators on this list; the PZ and FXSSI indicators belong to PointZero Trading and FXSSI. This is shared for educational purposes and is not financial advice.


Discussion no comments yet
Is this still working?
Nothing here yet
No one has asked anything about 10 Best MT5 Indicators , Tested Candle by Candle yet. First question gets answered.